
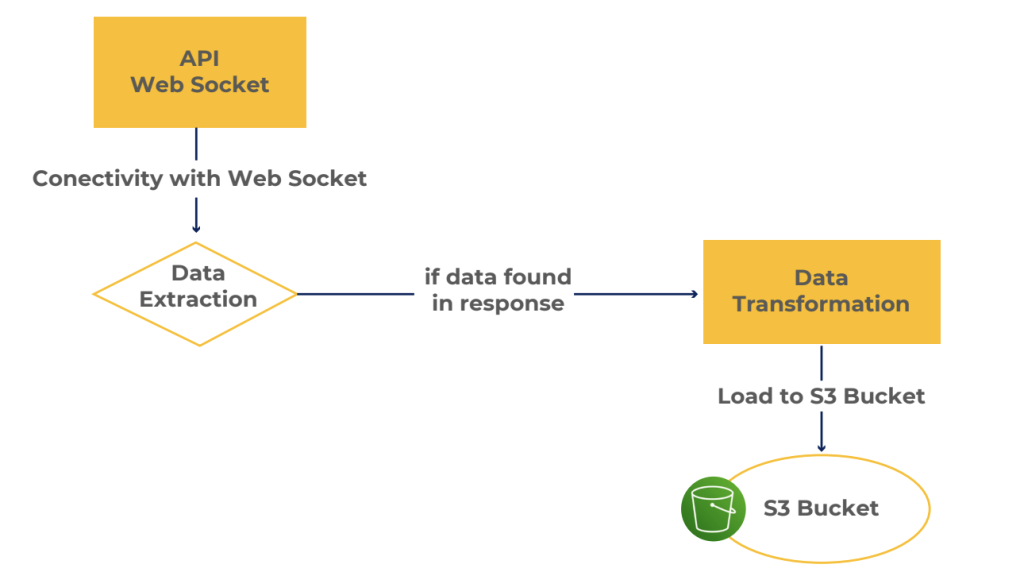
This step involves collecting and processing large amounts of market data, such as historical prices, trading volumes, and financial statements, for a large number of underlyings (more than 4,000). This data can be used to identify trends and patterns that can be used in the analysis and optimization process. Our connectivity with Web Sockets enhances the efficiency of this process. Upon discovering relevant data in the response, we seamlessly load it to the S3 Bucket, setting the stage for the subsequent steps.
The investment selection process involves a systematic and data-driven approach, applying mathematical and statistical models to identify underlyings that align with specific investment criteria based on key indicator and ratios defined by the Investment Management.
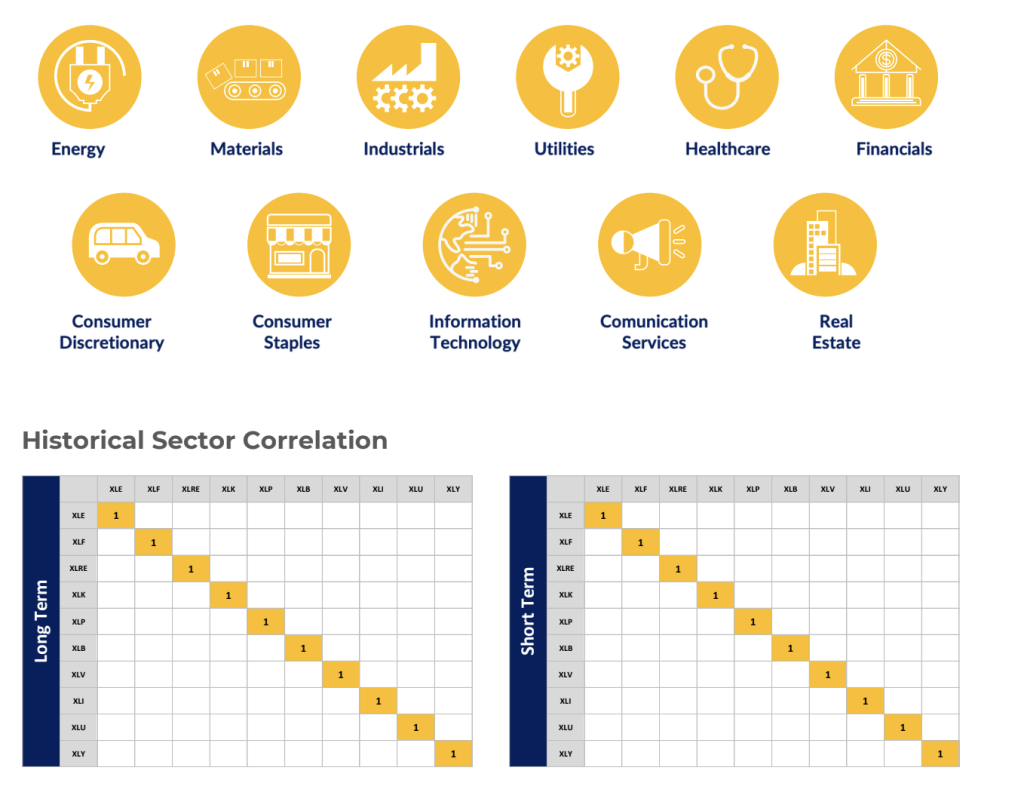
Initially, historical returns, volatility and correlations are analyzed to gauge a stock's past performance and risk characteristics.
Then we use macroeconomic factors to understand the prevailing business cycle, guiding investment decisions based on sector and industry performance trends. The goal is to achieve a better allocation in sectors, ensuring that our investment strategy is finely tuned to the broader economic landscape and positioned for optimal performance in varying market conditions.
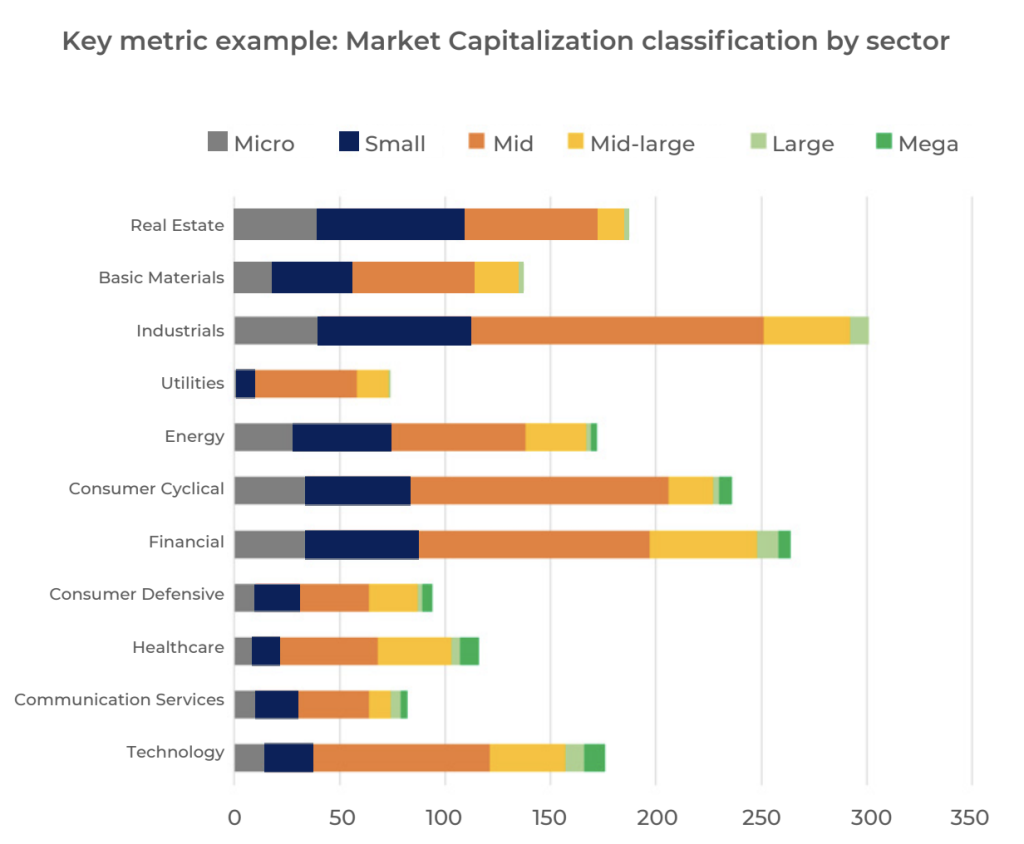
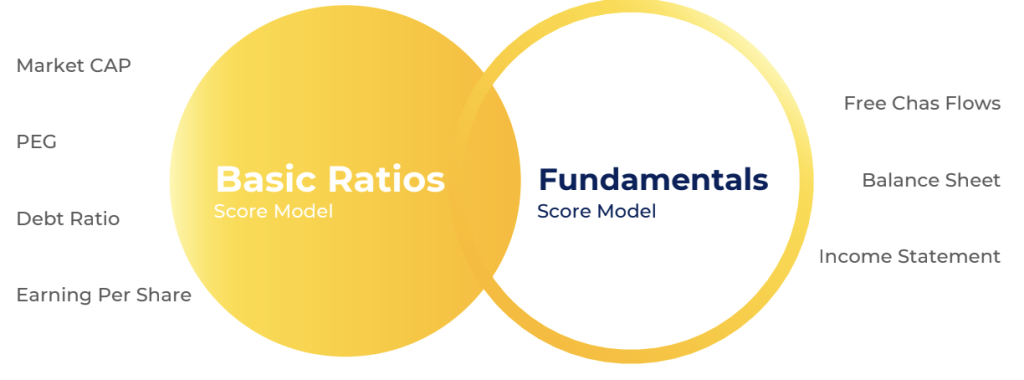
The process also incorporates a factor investing model, identifying key metrics such as earnings growth and financial health, which are historically associated with strong stock performance. These factors are then weighted and integrated into a scoring system, allowing for a quantitative assessment of each underlying's investment potential.
The final selection involves combining scores from various models to identify underlyings that consistently demonstrate strength across multiple criteria. Importantly, this approach is dynamic, requiring continuous monitoring and adjustments to adapt to changing market conditions and ensure the ongoing alignment of the portfolio with the investor's goals and risk tolerance.
The initial Data Base is reduced to a filtered population that will be the input list for the next step (optimization).
Once the underlyings have been filtered, you can evaluate the performance and statistics of each one individually. For example, we use scripts to calculate the Sharpe ratio, or other metrics that indicate the past performance of a stock. Additionally, Monte Carlo simulations and GARCH models are employed to simulate potential future scenarios and assess risk.
These advanced modeling techniques contribute to a more robust understanding of potential returns. Importantly, this approach remains dynamic, requiring continuous monitoring and adjustments to adapt to market changes and ensure alignment with investor goals and risk tolerance.
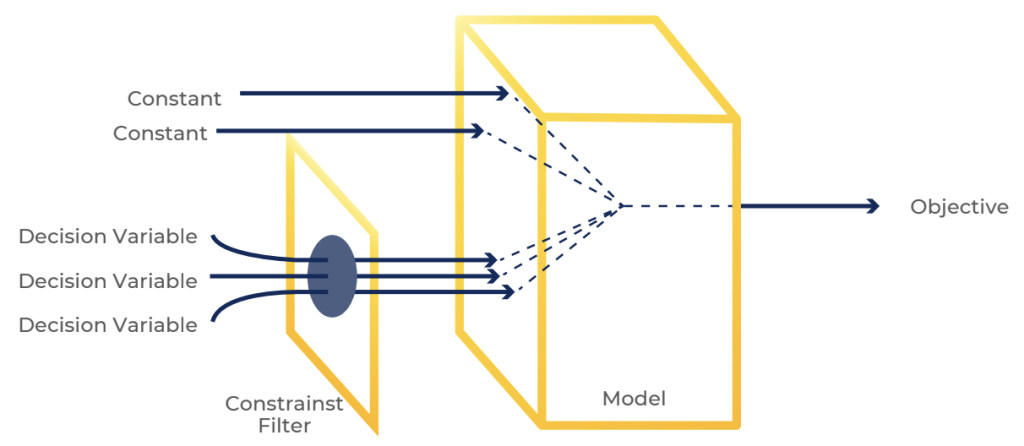
Our enhaced optimization model consider factors such as diversification, volatility and sector’s correlation to determine the optimal portfolio of underlyings that balances risk and return based on the performance target. For example, you could use a model that maximizes the expected return of the portfolio subject to constraints on the volatility of the portfolio.
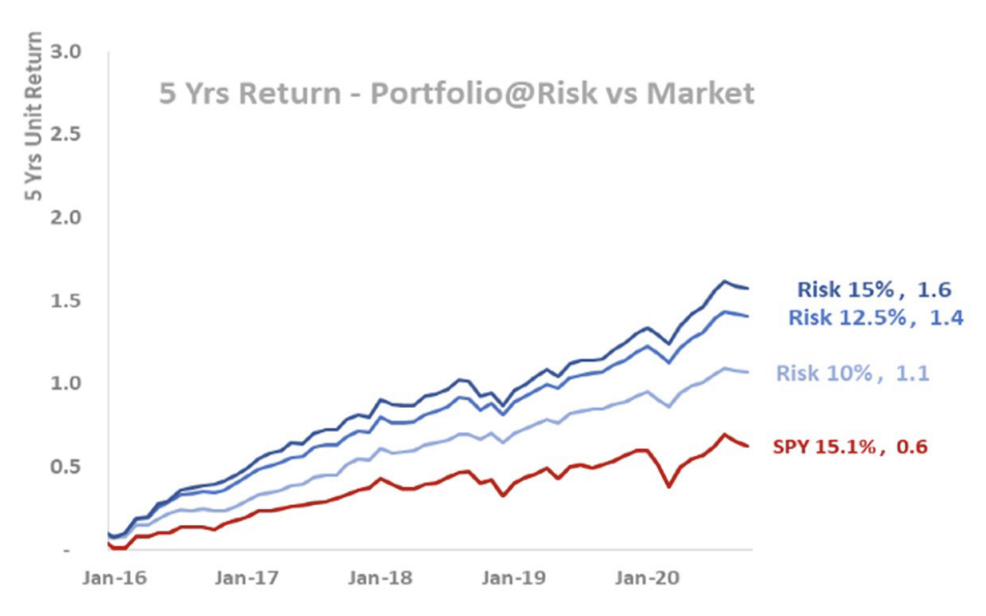
With the optimal portfolio a list of performance sensitivities, statics and simulations are tested to identify key metrics of expected performance.
As an example, for risk sensitivity Value-at-Risk, Short-Fall, Risk Contribution, etc. is calculated through an specific time period. Regarding to the forward simulations Monte Carlo and GARCH model are used to generate expected scenario of portfolio performance.
Once the portfolio has been defined and tested, it is important to perform a fundamental analysis of the selected underlyings.
This step can help to ensure that the portfolio remains aligned with the investor's long-term objectives. Additionally, the model should be regularly monitored to make sure that the portfolio remains optimal and adjust it when necessary.
